

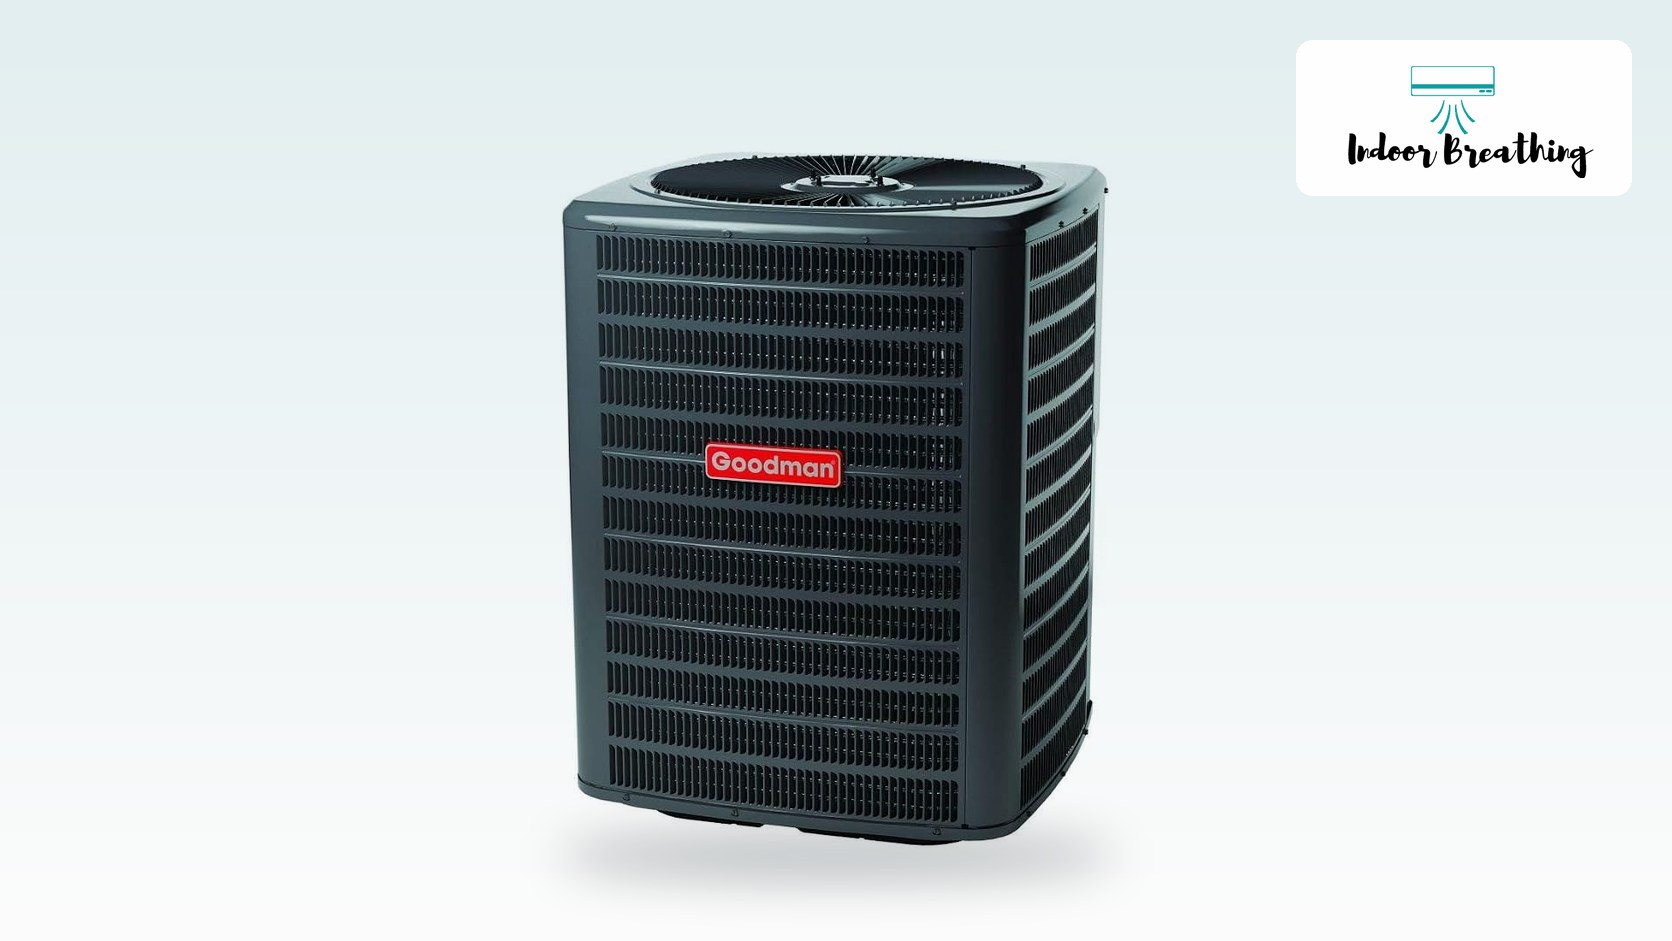
A higher SEER2 rating doesn’t save every household the same amount — the real dollar figure depends on your current system’s SEER rating, your local electricity rate, and how many hours a year your AC actually runs. A 10-year-old 10 SEER unit in a hot, humid climate can save well over $400 a year moving to a 15+ SEER2 replacement; the identical upgrade in a mild climate on a low electricity rate might save under $100. Run your own numbers instead of trusting a national average.
This guide’s savings math is cross-checked against U.S. Department of Energy SEER2 minimum-efficiency standards and the EIA’s published national residential electricity price. Rebates and rates change, so use your own.
Most people shop for a new air conditioner or heat pump by comparing SEER2 numbers on a sticker without ever converting that number into a dollar figure. That’s backwards — the SEER2 rating only matters because of what it does to your electric bill, and that dollar impact depends entirely on inputs specific to your house: how large your system is, what it’s replacing, how many hours it runs each summer, and what you pay per kilowatt-hour. Two households buying the identical new unit can see completely different payback timelines.
Table of Contents
How SEER2 Rating Determines Your Cooling Cost
SEER2 (Seasonal Energy Efficiency Ratio 2) measures how much cooling a system delivers per unit of electricity, tested under a revised U.S. Department of Energy procedure that replaced the older SEER metric for all equipment manufactured after January 1, 2023. The math is a simple ratio: annual cooling output (in BTU) divided by annual electricity consumed (in watt-hours). A higher SEER2 number means the same BTU of cooling costs less electricity to produce.
That relationship is inverse, not linear, which is the part most buyers miss. Going from 10 SEER to 13 SEER cuts energy use by about 23% (1 − 10÷13), but going from 20 SEER2 to 23 SEER2 — the same 3-point gap — only cuts energy use by about 13% (1 − 20÷23). The lower your starting SEER rating, the more absolute savings each additional point of efficiency buys. This is why replacing a genuinely old, inefficient system delivers dramatically better payback than upgrading a system that’s already reasonably efficient.
Current federal minimums, effective January 1, 2023, are regional: 13.4 SEER2 in northern states and 14.3 SEER2 in the Southeast and Southwest for split systems under 45,000 BTU/hr (all national heat pumps must also meet 14.3 SEER2). ENERGY STAR-qualified equipment currently starts around 15.2 SEER2, and the most efficient residential systems on the market today reach into the low-to-mid 20s SEER2. Where your current system and your shopping target both fall on that scale is what actually determines your savings — not the SEER2 number in isolation.
Electricity Rate, Climate, and Runtime: The Secondary Factors
SEER2 is the multiplier, but three other inputs determine how big a number it’s multiplying against.
Electricity rate varies enormously by state — from around $0.12/kWh in Idaho to over $0.33/kWh in California and above $0.50/kWh in Hawaii, according to the EIA’s most recent state-by-state data. The identical efficiency upgrade is worth roughly four times as much in a high-rate state as a low-rate one. Always check your own utility bill rather than relying on the national average.
Cooling hours per season depend on climate, and they vary far more than most people expect. DOE’s own federal-purchasing energy-use examples show a 3-ton reference system logging roughly 3,400 equivalent full-load cooling hours a year in the hot, humid Southeast, versus roughly 1,700 hours in northern and moderate climates — almost double. A household in Houston and a household in Minneapolis running the identical SEER2 upgrade will see very different annual savings purely from runtime.
System size scales everything linearly: a 4-ton system uses roughly a third more energy than a 3-ton system for the same SEER rating and runtime, so it also saves roughly a third more in absolute dollars from the same efficiency jump. Bigger systems have more to gain (and more to lose from being undersized on efficiency) than smaller ones.
Looking ahead, minimum efficiency rules keep rising, and heat pumps are taking more of the market from air conditioners. Rebates and tax credits can shift the payback by hundreds of dollars, but those programs change, so check what is live before you sign.
Calculate Your SEER2 Energy Savings
Rather than applying a single national average, plug in your system’s actual size, your current SEER rating (or its approximate installation year if you don’t know the rating), your real electricity rate, and your climate’s typical cooling hours. The calculator below runs the same formula DOE uses for its own federal-purchasing savings examples, scaled to your specific numbers instead of a fixed reference system.
1 ton = 12,000 BTU/hr. A typical home central system is 2–5 tons.
Current federal minimums: 13.4 SEER2 (North), 14.3 SEER2 (Southeast/Southwest). ENERGY STAR starts around 15.2 SEER2.
Defaults to the U.S. average residential rate (EIA, May 2026 data). Replace with your own utility rate for accuracy — rates range from about $0.12 to over $0.50/kWh by state.
Price difference versus a baseline code-minimum system — not the full installation cost. Leave blank to skip the payback estimate.
Estimated annual savings
kWh saved / year
—
Energy use cut by
—
Simple payback
—
What SEER2 rating is realistic to shop for?
Per the U.S. Department of Energy's own federal-purchasing acquisition guidance for residential central air conditioners (energy.gov, updated December 2024), the current baseline federal minimum is 13.4–14.3 SEER2 depending on region, ENERGY STAR-qualified equipment sits around 15.2 SEER2, and the best widely available residential systems reach roughly 23.5 SEER2. Most homeowners land in the 15–18 SEER2 range for a practical balance of upfront cost and efficiency gain — the jump from code-minimum to ENERGY STAR captures a large share of the available savings at a relatively modest cost premium, while chasing the top of the range delivers a smaller marginal gain (see the diminishing-returns math in the guide above) for a much larger price jump.
Typical SEER Rating by Installation Year
If you don’t know your current system’s SEER rating, its age is a reasonable proxy — every unit sold in the U.S. has to meet whatever the federal minimum was at the time of manufacture, and most builder-grade and standard replacement systems are installed right around that minimum.
| Installed | Typical Rating | Why |
|---|---|---|
| Before 1992 | ~6–8 SEER | No federal minimum existed yet |
| 1992–2005 | 10 SEER | NAECA national minimum, effective 1992 |
| 2006–2014 | 13 SEER | DOE minimum raised nationally, effective Jan. 23, 2006 |
| 2015–2022 | 13–14 SEER | First regional split (North/Southeast/Southwest), effective Jan. 1, 2015 |
| 2023–present | 13.4–14.3 SEER2 | SEER2 test-procedure update, effective Jan. 1, 2023 |
This is a starting estimate, not a substitute for your actual EnergyGuide label or nameplate — a system replaced early or a high-efficiency option chosen above the era’s minimum will run higher than this table suggests.
The risk to watch is paper savings. A high SEER2 number only pays off when the install is good, and leaky ducts, a wrong charge or the wrong size can wipe out a lot of it. Expect sellers to push the rating and say little about the install.
Why Your Real Savings Won’t Match the Manufacturer’s Efficiency Claim
Every SEER2 rating on an EnergyGuide label is measured in a lab, under a fixed DOE test procedure with controlled outdoor temperature bins, clean coils, correct refrigerant charge, and correctly sized ductwork. Your house doesn’t match that lab. According to ENERGY STAR, in a typical house about 20–30% of the air moving through the duct system is lost to leaks, holes, and poorly sealed connections before it ever reaches a room — energy your system paid to condition and then lost. Add an incorrect refrigerant charge, a thermostat left on a wide setback schedule, or a system that was oversized at installation and short-cycles instead of running efficient full loads, and the gap between the rated SEER2 number and your real-world savings widens further.
None of this means SEER2 comparisons are meaningless — a 20 SEER2 system is still meaningfully more efficient than a 13 SEER2 one in every real house. It means the specific dollar savings you’ll see depends as much on your ductwork, charge, and installation quality as it does on the rating sticker. A proper load calculation and a Quality Installation-certified contractor close more of that gap than any amount of extra SEER2 shopping.
Is Upgrading Worth It? Savings by Scenario
The math above plays out very differently depending on where you’re starting from:
- Old system (pre-2006), hot climate, high electricity rate: the strongest case for upgrading — a 10 SEER unit in Texas or Florida paying California-level rates can pay back a mid-efficiency replacement in well under five years just on electricity savings.
- 2015–2022 system, moderate climate: the harder case. You’re likely already at 13–14 SEER, so jumping to today’s 16–18 SEER2 range saves real money but rarely pays back equipment cost through electricity alone within the system’s remaining life — factor in the age and remaining reliability of the existing unit, not just the efficiency math.
- Failed system, any age: if you’re replacing a dead or dying unit anyway, the marginal cost of stepping from the code-minimum SEER2 to a mid-tier option is usually small relative to the full installation cost — run the calculator to see if that increment pays for itself before the system’s typical 15–20 year lifespan is up.
- Renters or short-term owners: the payback math matters less than for long-term owners — if you won’t be in the home long enough to recoup the cost difference, prioritize proper sizing over maximizing SEER2. Our AC and BTU sizing guide covers that math.
If you’re comparing specific central air systems, our Goodman GLXS4BA4210 review and Bryant Preferred review both include their published SEER2 ratings if you want to plug real candidate systems into the calculator above. And regardless of which system you choose, our HVAC maintenance guide covers the upkeep that keeps a system running near its rated efficiency for its full lifespan instead of drifting away from it.
FAQ
What’s the difference between SEER and SEER2?
SEER2 is a revised DOE test procedure, effective for equipment manufactured from January 1, 2023 onward, that uses a higher external static pressure during testing to better reflect real duct system resistance. A SEER2 number is roughly 4–5% lower than the equivalent old-SEER number for the same physical equipment — they’re not directly interchangeable without a rough conversion.
Does a higher SEER2 rating always mean lower cooling cost?
For the same system size, climate, and runtime, yes — a higher SEER2 rating always uses less electricity per BTU of cooling delivered. Whether it’s worth the higher upfront cost depends on your specific savings-per-year figure versus the price difference, which is exactly what the calculator above estimates.
How accurate is estimating your current SEER from your system’s age?
It’s a reasonable starting estimate since every unit has to meet the federal minimum in effect when it was manufactured, but it’s not exact — some systems were installed above the era’s minimum. Check your outdoor unit’s nameplate or your original installation paperwork for the actual rated SEER if you want a precise number instead of an age-based estimate.
Do heat pumps use the same SEER2 math as air conditioners?
Yes, for the cooling side — heat pumps are rated with the same SEER2 metric for summer cooling performance (they have a separate HSPF2 rating for winter heating). The calculator above applies to either equipment type’s cooling-mode savings.
Why does your climate matter so much to the savings number?
Because savings only accrue while the system is actually running. DOE’s own reference data shows a 3-ton system logging roughly double the annual cooling hours in the hot, humid Southeast compared to northern and moderate climates — so the identical efficiency upgrade is worth roughly double the annual dollar savings in the hotter climate, purely from runtime.
Does upgrading SEER2 rating affect humidity control too?
Often, yes, though indirectly — higher-efficiency systems are more commonly paired with variable-speed or multi-stage compressors that run longer at lower capacity, which removes more humidity per hour of operation than a single-stage system’s short, powerful bursts. That’s a comfort benefit alongside the electricity savings this calculator estimates.
Should you include installation cost in the payback estimate?
Only the incremental cost of the higher-SEER2 option over a baseline code-minimum system, not the full installation price — you’d pay for a baseline replacement either way once your system needs replacing. The calculator’s optional payback field is built for that incremental-cost comparison.
Related Guides
Keep going with the SEER2 savings calculator, the AC tonnage calculator, how a central air conditioner works, mini-split SEER2 ratings and central AC not cooling.
What happens next: electricity prices are climbing in many areas, which makes each saved kilowatt-hour worth more. Run the numbers with your own rate, climate and run time, and ask for the duct test as part of any quote.
Bottom Line
SEER2 shopping without running the numbers is guesswork. The same rating jump can be worth $400 a year or $50 a year depending on your system size, current rating, electricity rate, and climate — four inputs that vary by house, not by national average. Use the calculator above with your own numbers before deciding how much extra efficiency is worth paying for.